
by Saneesh V | Aug 6, 2018 | Analytics, R
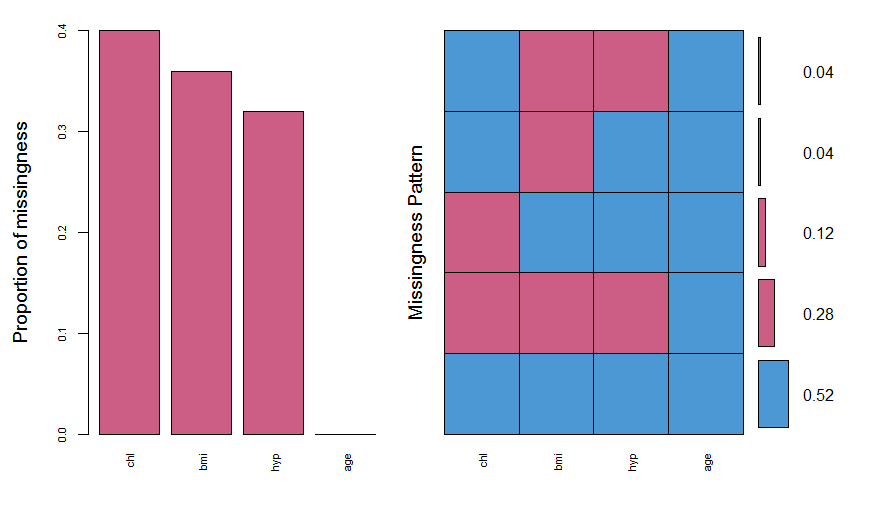
Handling missing values is one of the worst nightmares a data analyst dreams of. In situations, a wise analyst ‘imputes’ the missing values instead of dropping them from the data. Missing Data in Analysis At times while working on data, one may come across missing...

by Saneesh V | Aug 5, 2018 | Analytics, R
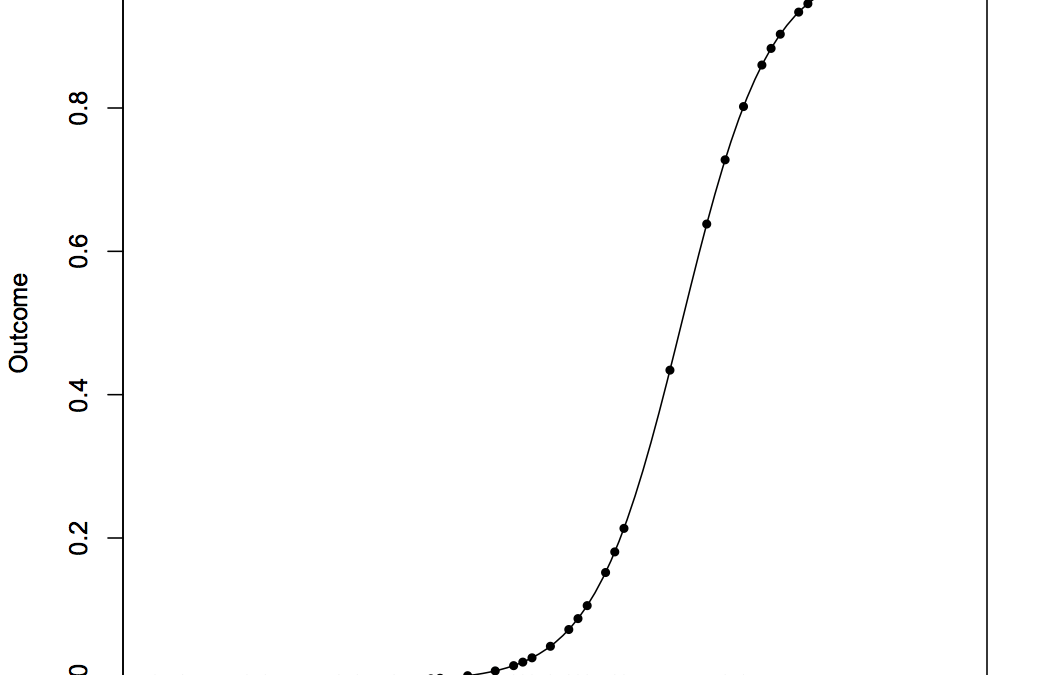
In this article, we aim to discuss various GLMs that are widely used in the industry. We focus on: a) log-linear regression b) interpreting log-transformations and c) binary logistic regression. Editor’s note: Data files discussed below can be acquired here:...

by Saneesh V | Aug 4, 2018 | Analytics, R
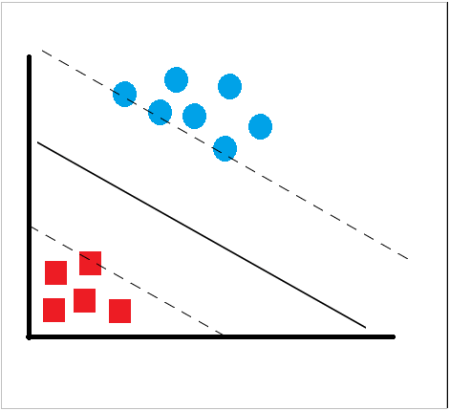
Support Vector Machines (SVM) is a data classification method that separates data using hyperplanes. The concept of SVM is very intuitive and easily understandable. If we have labeled data, SVM can be used to generate multiple separating hyperplanes such that the data...
by Saneesh V | Aug 3, 2018 | Analytics, R
If something takes less time if done through parallel processing, why not do it and save time? Modern laptops and PCs today have multi core processors with sufficient amount of memory available and one can use it to generate outputs quickly. Parallelizing your codes...

by Saneesh V | Aug 2, 2018 | Analytics, R
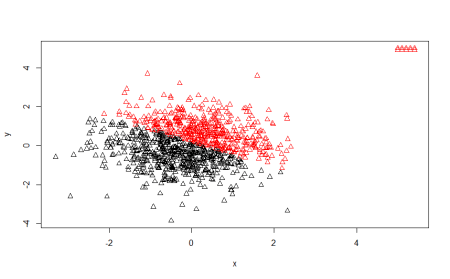
K-Means Clustering is a well known technique based on unsupervised learning. As the name mentions, it forms ‘K’ clusters over the data using mean of the data. Unsupervised algorithms are a class of algorithms one should tread on carefully. Using the wrong algorithm...

by Saneesh V | Aug 1, 2018 | Analytics, R
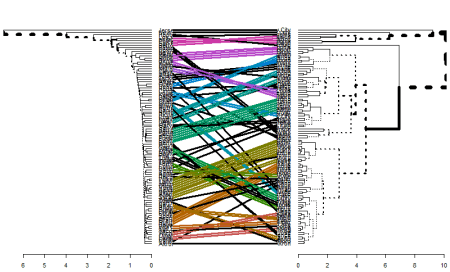
What is Hierarchical Clustering? Clustering is a technique to club similar data points into one group and separate out dissimilar observations into different groups or clusters. In Hierarchical Clustering, clusters are created such that they have a predetermined...


Recent Comments