by Saneesh V | Aug 29, 2018 | Analytics, Marketing, Tableau Authority, Visualization
Did you know that Netflix has over 76,000 genres to categorize its movie and tv show database? I am sure this must be as shocking to you as this was to me when I read about it first. Genres, rather micro-genres, could be as granular as...

by Saneesh V | Aug 28, 2018 | Analytics, List of Blogs, Visualization
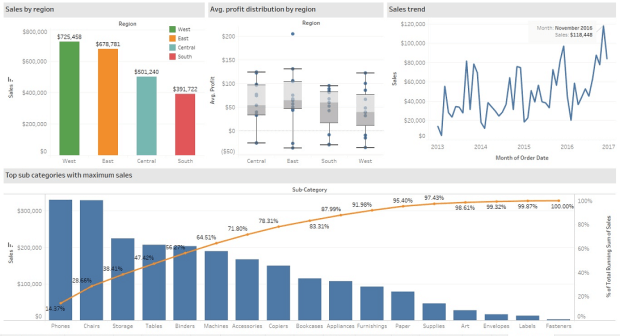
Business heads often use KPI tracking dashboards that provide a quick overview of their company’s performance and well-being. A KPI tracking dashboard collects, groups, organizes and visualizes the company’s important metrics either in a horizontal or vertical manner....


Recent Comments