by admin | Oct 11, 2018 | Analytics, Resources, Tableau Authority
The project was to create Tableau Dashboards for visualizing financial information of different stocks/tickers that would be used by Financial Analysts. The data had to be obtained through an Application Programming Interface (API) of a third-party service provider...

by Saneesh V | Aug 28, 2018 | Analytics, List of Blogs, Visualization
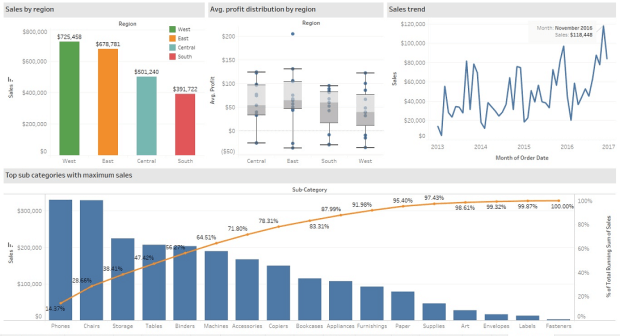
Business heads often use KPI tracking dashboards that provide a quick overview of their company’s performance and well-being. A KPI tracking dashboard collects, groups, organizes and visualizes the company’s important metrics either in a horizontal or vertical manner....


Recent Comments